A visual guide to measuring chaos
Visualizing a Measurement of Chaos
This is a small visual experiment to demonstrate the principle of the 01 chaos test, to test chaoticity of observed time series data. Although other measures exist for the measurement of chaos, this test does not require the knowledge of the underlying equation, or the reconstruction of the phase space. Thus, it can be easily applied to observed time series data, for example from the brain.
 Visualization of a test for Chaos
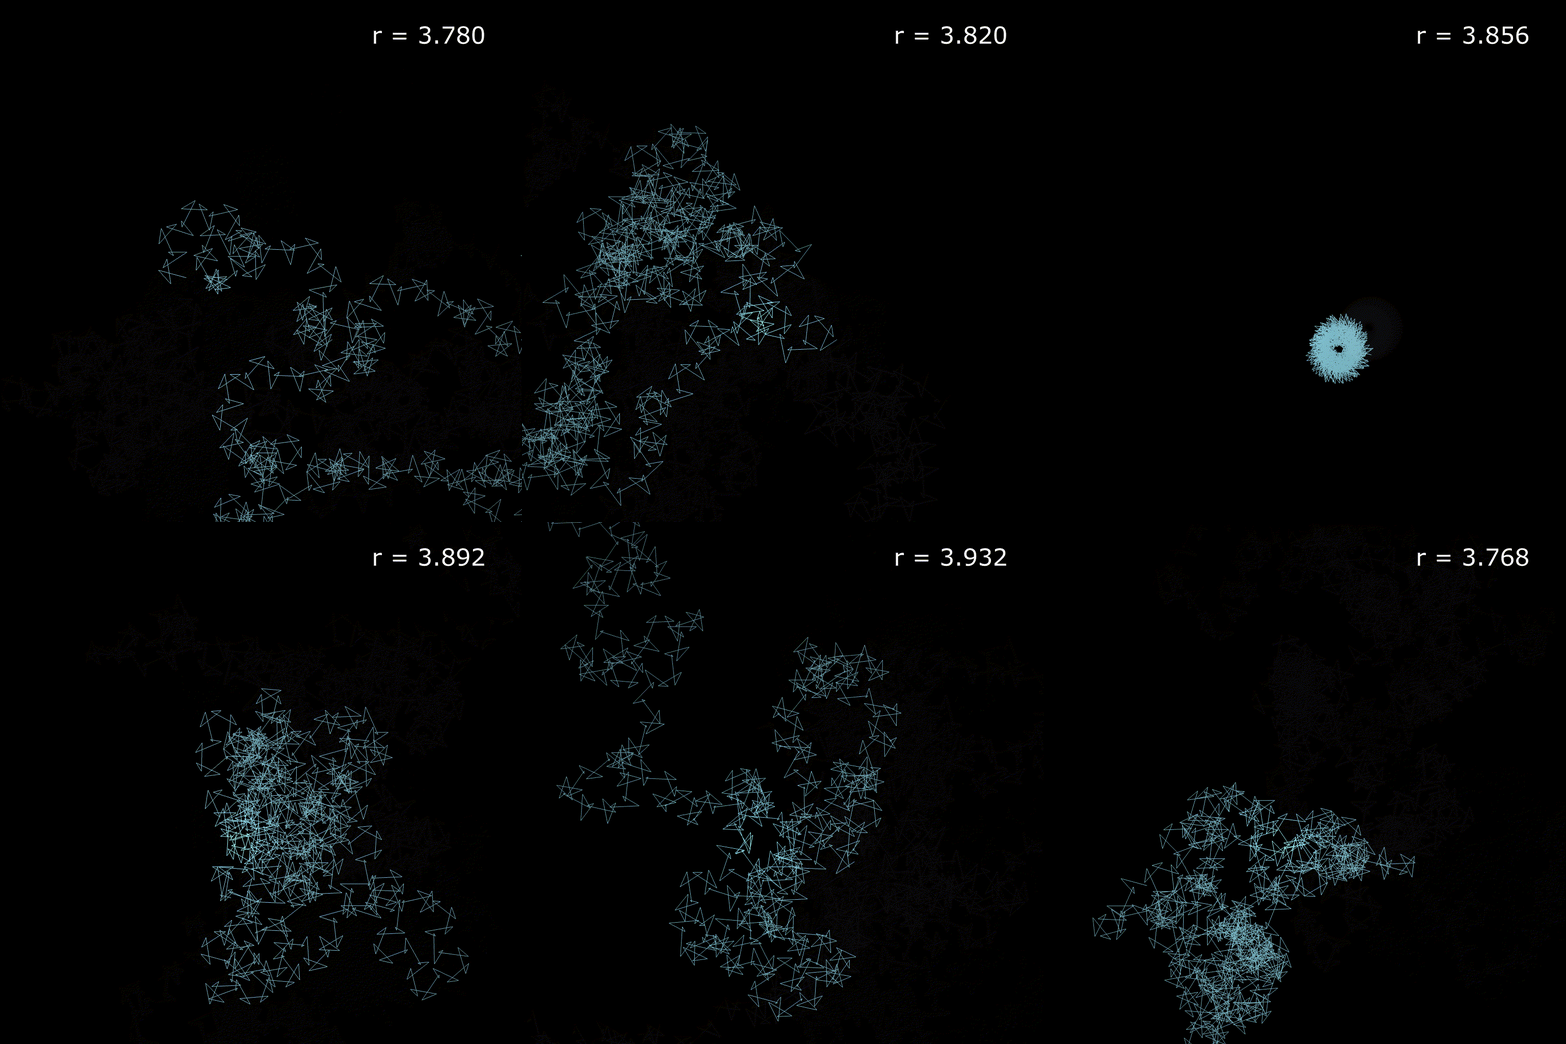
This visual captures different time series generated using the logistic map. Changing the parameter r makes the time series either stable/regular or highly chaotic. The 01chaos test uses brownian motion to estimate the chaoticity of an observed time series. Moments of stability yield beautiful round geometric patterns, moments of chaos lead to a wide motion over space. for a more detailed explication of the figures, have a look at this python notebook and the original paper by Gottwald and Merbourne 2009
 Visualization of a test for Chaos
