Generative Art with Brain Data
Genuary 2023
Genuray is an artificially generated month of time where we build code that makes beautiful visualizations. This year, I participated in 4 days of this month with the aim of visualizing 5 minutes of my resting-state brain signal, as recorded by an electroencephalogram (EEG). Every day, another prompt is provided by the organizers. The rest is just creativity. It is the first year that I am participating and I just started learning TouchDesigner.
Day 1: Perfect loop
For day 1, I got inspired by a Moebius strip, which builds an infinite loop. Adding towards this, this Moebius strip contains some EEG spectrogram, visualizing power over frequencies.

Day 2: Made in 10 minutes
The topic was less than 10 minutes, but it rather took me an hour… The turning sculpture inside the visual is a combination of 90 channels of raw brain data, projected to three dimensions.
Day 3: Glitch Art
How would brain data look like if every recording channel would be interpreted as a colour value ? I used 3 brain electrodes as r, g and b values to define a colour and visualized a total of 100 brain electrodes
Day 4: Intersections
How about a ball rolling in a space of EEG? Why not!
Day 11: Suprematism
An unusual way to visualize brain data, but this is how an EEG spectrogram could look like in the style of Suprematism. It contains 1 min of brain data. The size of the shapes corresponds to power in different frequency bands.
The Lorenz brain
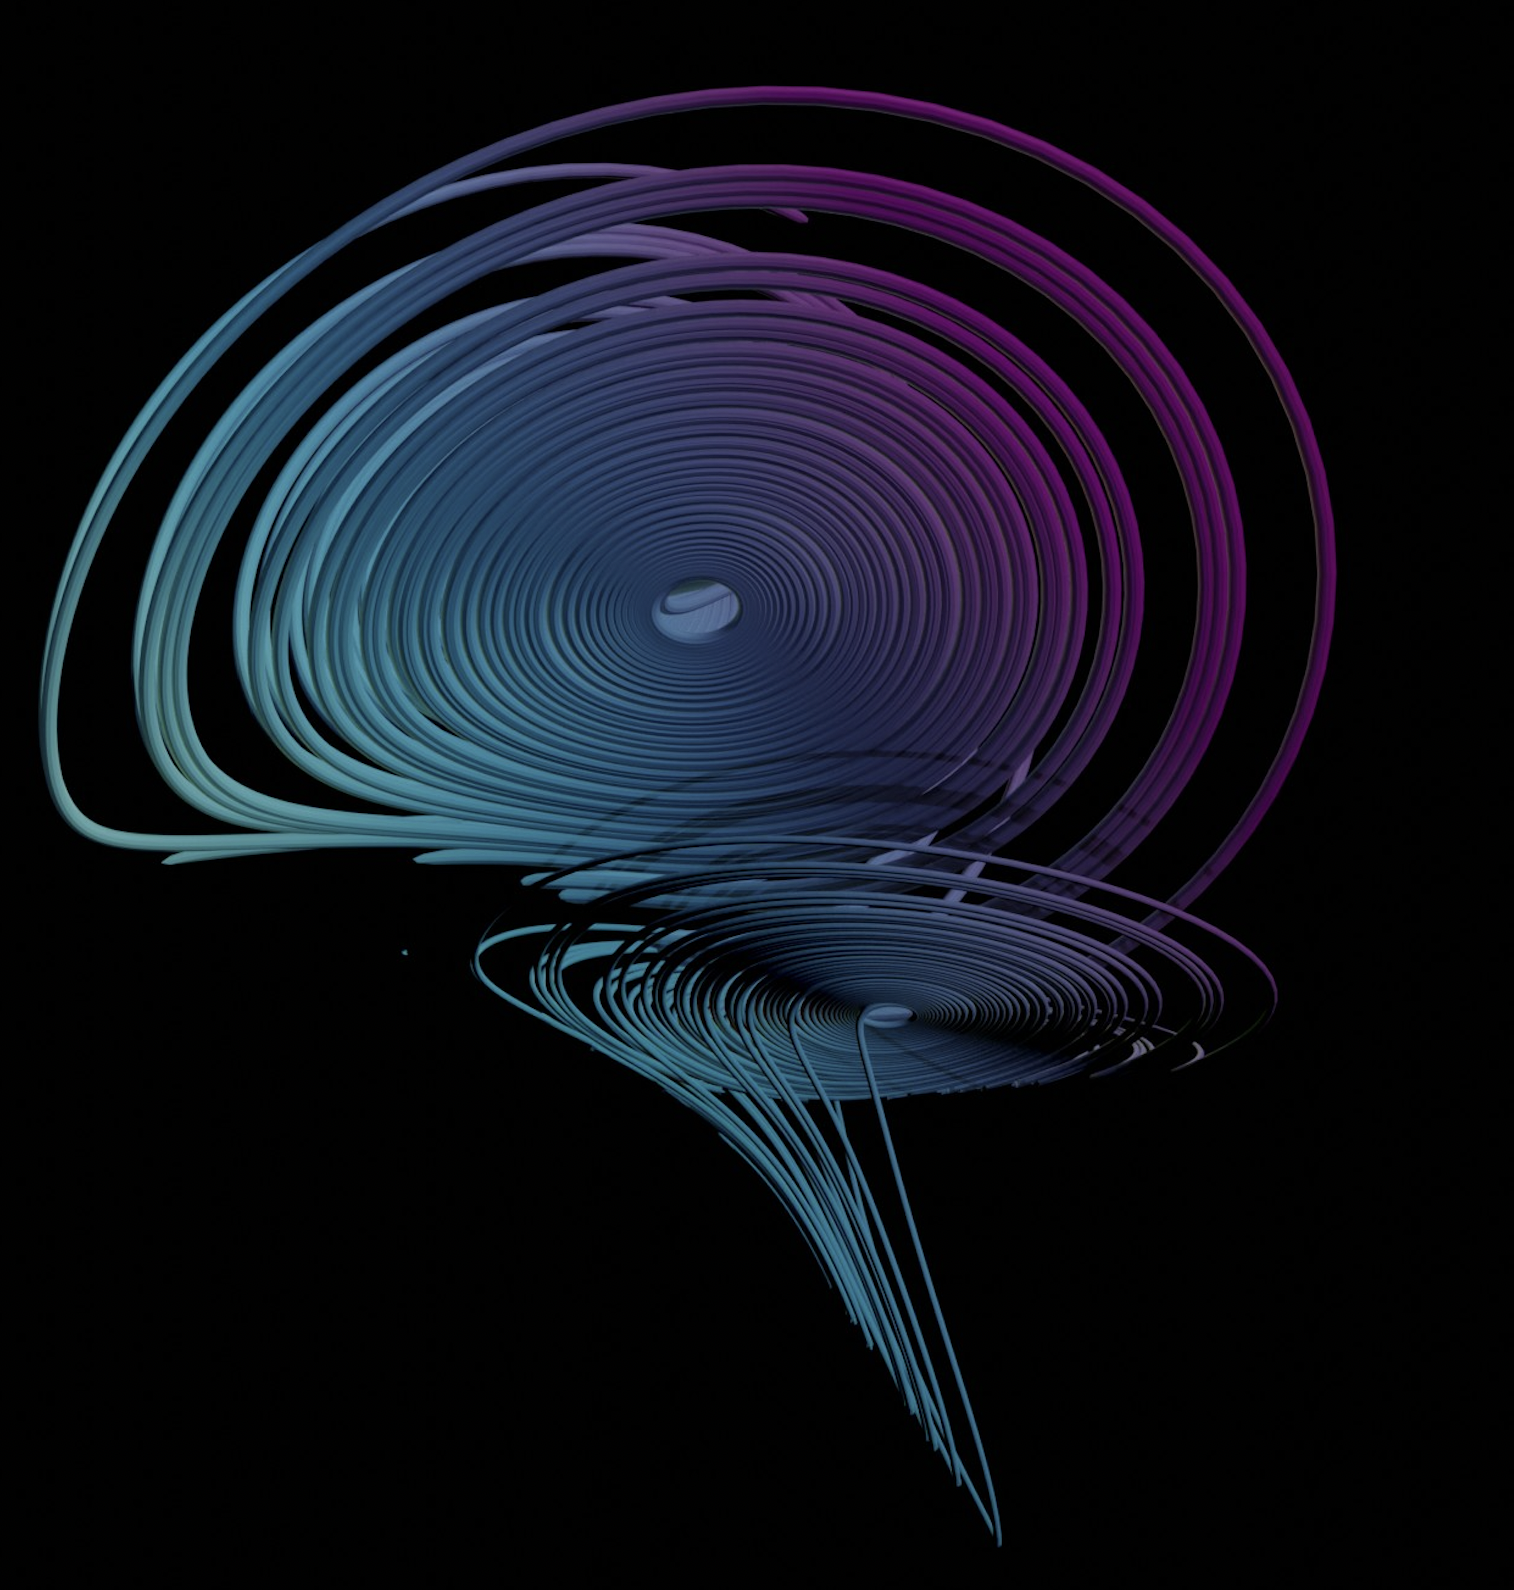 A Lorenzian Brain
Brain WAVES
 EEG Brain Waves
EEG Spectrogram
 Spectrogram